You can use Forecasting to predict future trends in clicks, conversion, revenue, cost, and profit based on historical data. These predictions can be used as guidelines to adjust bidding goals based on current business needs. The trends are calculated using Marin's predictive keyword-level auction and volume models, which are then aggregated to present a Strategy-level graph.
How To
- Click on the Optimize in the left-hand navigation.
- Select the Strategies sub-tab.
- Click on the Forecasting toggle in the top-right of your grid. Click once to slide the toggle over to the right (it will turn green when enabled).

Turning the toggle on will, by default, enable account-level forecasting, including Budget Pacing and Budget What-If features. To learn more about these tools, check out our dedicated article. - Before you review your forecasting, double-check your date range by clicking on the Calendar icon above the grid. You can choose between This Week, This Month, This Quarter, Next Month, and Next Quarter.
- To see forecasting for a single Strategy, simply click the check-box next to the relevant Strategy.
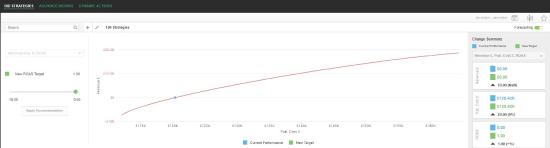
- You can hover over the chart for more analysis or use the Target slider to the left of the chart to experiment with different outcomes.
- The graph shows predicted changes in different key performance indicators based on changes to the Strategy target. Note the numbers predicted by Forecasting are estimated average daily values for different metrics.
- To see the predictions, click on the graph to select a new bidding target (the target is on the x-axis of the graph). You can set the x-axis to be either spend or ROAS. The most recent four weeks of historical data is used to build forecasting models which predict the metrics shown. The historical data is time-weighted to treat recent data as more important.
- You can export the forecast chart to a dashboard if you wish, simply by saving it as a Saved View, then adding it to a dashboard. For more information about dashboards, check out our dedicated article.
- If you see an outcome you like, simply click Apply Recommendations to target your new spend goal. Marin Bidding will adjust your Strategy targets accordingly in order to reach your goal.
Auction And Volume Models
Predictive Auction and Volume Models are built for both head and tail terms in each Strategy.
Keyword-level models are built for all head terms with more than 28 clicks in the past 28 days, while cluster-based models are built for similar tail terms in a Strategy with less than 28 clicks in the past 28 days. For both head and tail keywords, the Auction Model predicts the relationship between Bid and Cost per Click (CPC) based on historical Average Bid and Average CPC. It uses a half-logistic regression to model this relationship. The Volume Model predicts changes to expected daily clicks based on Cost per Click using a full-logistic regression. Cross-Keyword information is leveraged when keywords don't have enough movement to guide the parameter bounds. Using the keyword - and cluster - level Auction and Volume models, we can predict the change in expected clicks based on Bid values and expected cost.
Predicting Conversions And Revenue
The expected clicks are predicted for a given bid by the Auction and Volume models as described above. Using the conversion rate predicted for each keyword by our Bayesian based algorithm multiplied by the expected clicks we predict the conversions for each keyword in a Strategy. Similarly the revenue for each keyword can be predicted by multiplying the revenue per conversion by the expected conversion.
Confidence Intervals
Confidence intervals can be displayed for all metrics on the forecasting chart. The interval shown is the estimated range where forecasting is 90% confident with the predicted performance metric.
Note: The Confidence intervals are only displayed if you are using the algorithmic bidding model.
