Marin Tracker is Marin’s own conversion and revenue tracking solution. If you would like to learn more about Marin Tracker, please reach out to your Marin platform representative.
If you're already using Marin Tracker, we offer a convenient Marin Tracker Diagnostics Dashboard that can be used to keep tabs on your tracking setup.
The Marin Tracker Diagnostics Dashboard is currently a beta feature. If you're interested in testing this feature for your Marin client account, please reach out to a platform representative.
The Tracker Diagnostics Dashboard
How To Access The Dashboard
- The first step, like usual, is to log into Marin.
- Once you're logged in, click into the Admin section ('gear' icon) from the bottom left-hand corner.
- Next, click on the Revenue & Tracking tab in the top navigation.
- Then, go ahead and click on the Marin Tracker drop-down and select Tracker Diagnostics.
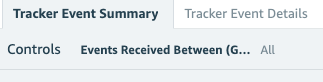
- The Tracker Diagnostics Dashboard contains two tabs:
- Tracker Event Summary: This is a summary of your raw Tracker data through various graphs, tables, and visuals, showing up to the last 30 days of Tracker data.
- Tracker Event Details: This is a filterable table showing the past 7 days of Tracker data.
Exporting Data To CSV
All data in the Tracker Diagnostics dashboard is based on raw, unattributed Tracker events, captured by Marin Tracker.
Data for every single widget in the Diagnostics Dashboard can be exported!
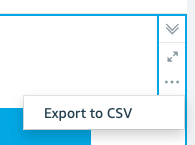
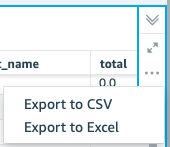
To export data from the Diagnostics Dashboard, simply click on the widget for which you would like to export raw data. This will then show options in the top right-hand corner of the widget (this doesn't show by default). Click on the 'Three Dots' icon to show Export to CSV.
Tracker Event Summary
By default the Tracker Event Summary sub-tab shows a summary of all Marin Tracker events received within the last 30 days.
Please note all dates and times are in the GMT time zone.
Changing The Date Range
You can display up to the past 30 days of data by using the Controls at the top of the dashboard.
This gives you the option to change the date and time range as needed, within the 30-day window.
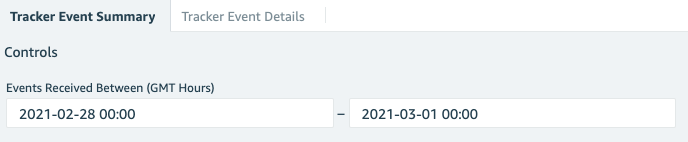
Please note the date and time filters will only apply to the Tracker Event Summary sub-tab.
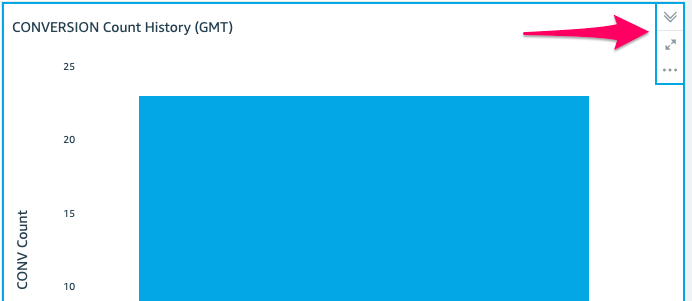
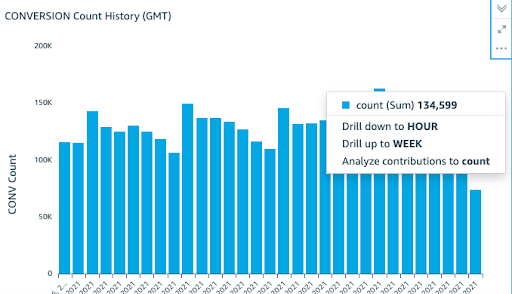
Bar Charts: Drilling Down To Hours And Minutes
Click on the bars in various bar charts to display further drill-down and drill-up data options. For instance, in the Conversion Count History chart, you might see something like this:
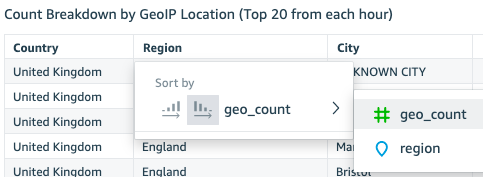
Sorting Data Within Tables
Clicking on the Headers for the tables in the dashboard gives you option to sort the data.
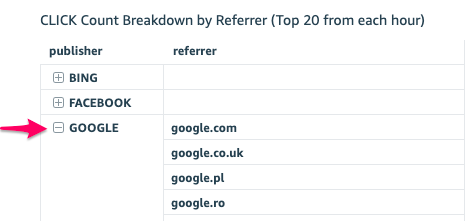
Expanding Data Within Tables
Clicking the ‘plus’ and ‘minus’ signs inside different tables allows you to expand or minimize details.
The Tracking Params Tables
The Click Count Breakdown by Tracking Params table and the Details for Invalid Tracking Params Value table work together.
Clicking on each parameter type name in the table on the left will update the table on the right with a list of invalid values for that parameter type.
For example:
- Clicking to the right of TRACKING_VALUE will show Parsed and Invalid sample values of TRACKING_VALUE TrackingID (e.g. mkwid)
- Clicking on Parsed TRACKING_VALUE would only show Parsed samples for mkwid.
- Clicking on Invalid TRACKING_VALUE would only show Invalid samples of mkwid.
- And the same goes for other TrackingID Types.
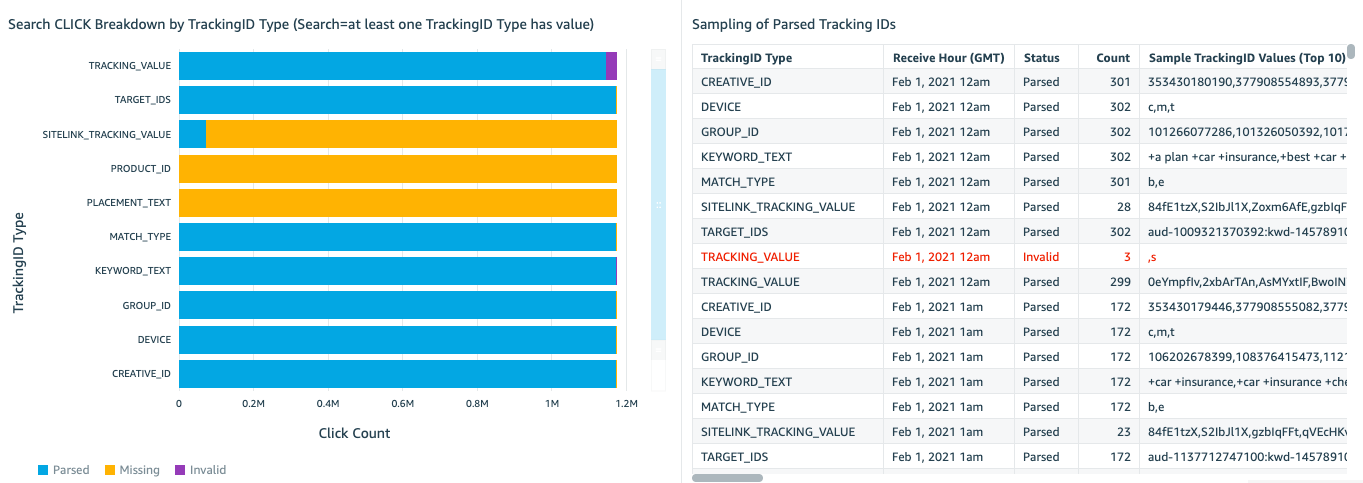
Invalid tracking IDs are values which we were able to parse but which appear to be incorrect:
- For TRACKING_VALUE (e.g. MKWID), Invalid means less than 3 characters or more than 255, or contains characters such as: ‘?', '\\', ',', '(', ')', '&', '!'
- For KEYWORD, Invalid keyword texts mean longer than 80 characters or more than ten words, or containing invalid characters such as: '?', '\\', ',', '(', ')', '!'}
Please note Sample Values are grouped by Hour, to allow spotting hourly trends.
Inferred Device And Parsed Device
The Parsed device count refers to the instances where you have added a device parameter to your URLs, and where Marin was able to parse out the device from that URL parameter.
Inferred device is a Marin Tracker feature that allows us to infer the device from the remainder of the rest of the Marin Tracker query, if the device parameter is missing from your URLs.
Online Order ID Analysis Table & Chart
The Order ID status by Conversion Type table and Invalid or Missing Order ID Trend chart highlight useful information about the Order IDs you send through tags.
An invalid order ID is a value that’s too short (less than 3 characters) or a hard coded value such as @Order_ID@ or ‘undefined’.
The Order ID Status by Conversion Type table will also alert you if we find instances where you are passing email addresses in the order ID field with a note to reach out to your Marin platform representative. Per data privacy laws and regulations, you cannot use Personally Identifiable Information in that way.
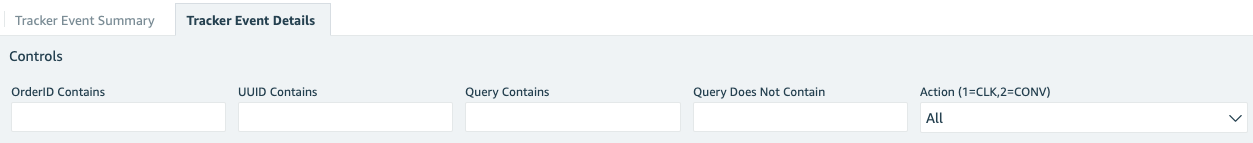
Tracker Event Details
By default the Tracker Events Details sub-tab shows individual Tracker Events received within the last 7 days. That date range is fixed. Except for the client_date column, all dates and times are in GMT.
You can use the controls to further filter the table based on:
- Order ID
- UUID
- Query string
- Clicks (action 1) or Conversions (action 2)
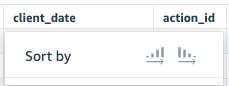
You can click the column header for sorting options.
Or click the top-right corner to show options to export data.
Offline Connect Diagnostics Dashboard
Offline Connect is a Marin Tracker add-on, allowing advertisers to load offline conversion data into Marin via Order ID. If you would like to learn more about Offline Connect, please reach out to your Marin platform representative.
How To Access The Dashboard
- The first step, like usual, is to log into Marin.
- Once you're logged in, click into the Admin section ('gear' icon) from the bottom left-hand corner.
- Next, click on the Revenue & Tracking tab in the top navigation.
- Then, go ahead and click on the Marin Tracker drop-down and select Tracker Diagnostics (Offline Connect).
The Offline Connect Diagnostics Dashboard contains 2 tabs:
- Match Rate Analysis: This is a summary of your raw Offline Connect data and match rates.
- Online OrderID Analysis: This is a view of the valid and invalid Order IDs you provide.

Data for every single widget in the Diagnostics Dashboard can be exported!
To export data from the Diagnostics Dashboard, simply click on the widget for which you would like to export raw data. This will then show options in the top right-hand corner of the widget (this doesn't show by default). Click on the 'Three Dots' icon to show Export to CSV.
Offline Connect Summary Tab
Changing The Date Range
You can display up to the last 180 days worth of data in the dashboard. Use the Controls to change the date range.
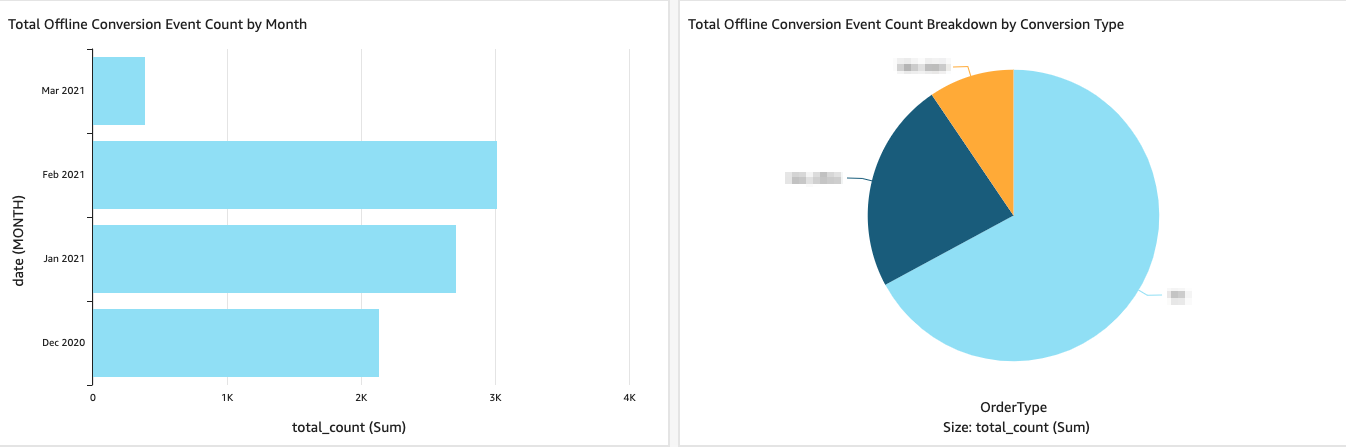
The first two widgets also act as filters for the entire dashboard. For example, you can click on the Feb 2021 bar in the chart to filter the dashboard for Feb 2021 only, or click on the pie chart portion for a certain conversion type to filter the dashboard for that specific conversion event. Simply click on the chart again to remove the filter.
Areas That Need Your Attention
In some of the tables, the following icon highlights areas that may need your attention: 
For instance, this icon might indicate a day where no data was attributed for a certain conversion type, or a day where we seem to have received duplicate files from you.
An Order ID can be attributed if:
- OrderID matched Online Conversion OrderID from within last 2 years
- Online Conversion must itself be Attributable Conversion (eg can associate with valid Search Click)
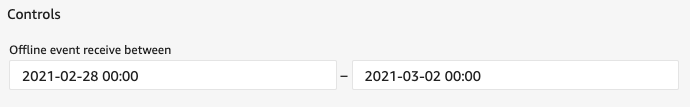
Offline Connect Details Sub-Tab
This tab allows you to view a report of all Offline Connect activity within the last 30 days (all dates and times in GMT), along with the name of the Offline Connect file the data was in.
You can filter the report using the controls at the top of the sub-tab.

Frequently Asked Questions
Why Can’t I See The Dashboard?
The Tracker Dashboards are only available to customers who leverage Marin Tracker. The Offline Connect dashboard is only available to customers who leverage Marin Tracker AND Offline Connect. If you’re not currently using Marin Tracker and Offline Connect but are interested in learning more, reach out to your Marin platform representative.
Also, keep in mind that the Marin Tracker Diagnostics Dashboard is currently a beta feature. If you're interested in testing this feature for your Marin client account, please reach out to a platform representative.
I Use Marin Tracker But I Still Can’t See The Dashboard?
There may be a couple of reasons why you can’t see the dashboard :
- If you leverage Cross Client Attribution (CCA), the Tracker Diagnostics Dashboard will only show in the parent account for the CCA group. If you’re unsure which of your accounts is the parent for CCA, reach out to your Marin platform representative for assistance.
- Login user is not a Marin Admin User.
I Use Cross Client Attribution, Where Can I See The Dashboard?
If you leverage Cross Client Attribution (CCA), the Tracker Diagnostics Dashboard will only show in the parent account for the CCA group. If you’re unsure which of your accounts is the parent for CCA, reach out to your Marin platform representative for assistance.
What Does "No Data Found For The Visual" Mean?
You may come across an error message that says No data: There was no data found for the visual.
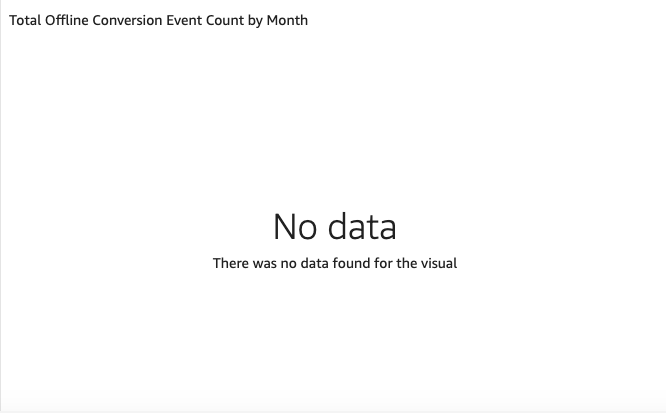
This error message will show in the following instances:
- You don’t use Marin Tracker as your source of revenue and conversion data.
- You use Marin Tracker as your source of revenue and conversion data with Cross Client Attribution (CCA). This error message will show in the child accounts in the CCA group.
- You have selected a date range for which you have no Marin Tracker data to display
