Marin's BI Connect is a tool that allows you to integrate your Marin data into the Business Intelligence tool of your choice, including Tableau, Google Data Studio, and more.
It can also be used as a data source, allowing you to create custom dashboards and reports in your own BI Tool, or accessed directly for integration with your own in-house data warehouse.
Why Use BI Connect?
By using BI Connect with Marin, you'll enjoy:
- Comprehensive access to data at all levels of your publisher hierarchy (campaign, ad group, ad, ad extensions, and dynamic targets, just to name a few)
- Enterprise-level data security
- Automated stitching of cost with 3rd-party revenue data
- Flexible data hosting on your cloud or ours
- Simplify reporting with Marin dimensions and custom columns
- Minimize dependency on internal teams and leverage Marin to do the heavy lifting
How It Works
BI Connect works using Client Tags. To learn more about Client Tags, check out our dedicated article.
Once Client Tags have been set up, BI Connect works in the following way:
- Publishers accounts and 3rd-party revenue is linked to Marin.
- Data is pushed daily to the cloud storage of your choice.
- Marin provides ETL (Extract, Load, Transform) and target schema. No need to aggregate or map data - it’s already organized and loaded by Marin.
- Key metrics exposed in additive form, such as quality score, bid, available impressions, etc
- You can then connect the BI tool of your choice via PostgreSQL or Amazon Redshift.
How to Connect
Your Marin account representative will provide you with the DB host and credentials to access BI Connect. A username and password will be created for you.
| DB Connection Type | Amazon Redshift or PostgreSQL |
| DB Host* | connect.marinsoftware.com |
| DB Port | 5439 |
| DB Name | dev |
| DB Schema | reporting |
| Username | To be provided |
| Password | To be provided |
* If you intend to leverage Microsoft's PowerBI to access BI Connect, you will need to use a different URL for the DB Host. Please let your Marin account representative know and they will provide you with the required DB Host.
The above credentials will give you access to the following Views in the reporting schema. All views will contain cost and conversion metrics aggregated at that particular object-level as well as object details.
| Name | Device-level Metrics available |
| clients | No |
| accounts | Yes |
| campaigns | Yes |
| groups | Yes |
| creatives | No |
| keywords | No |
| product_targets | No |
| shopping_products | No |
| ad_extensions | Yes |
| dynamic_targets | Yes |
| forecasts | No |
Although you may be able to see some additional tables in other schemas, you won't be able to access any of them. You will only be able to access tables in the reporting schema.
Connection Examples
You can connect BI Connect with any BI tool that supports a PostgreeSQL or Amazon Redshift connection. Here are a couple of examples that have been tested.
Tableau
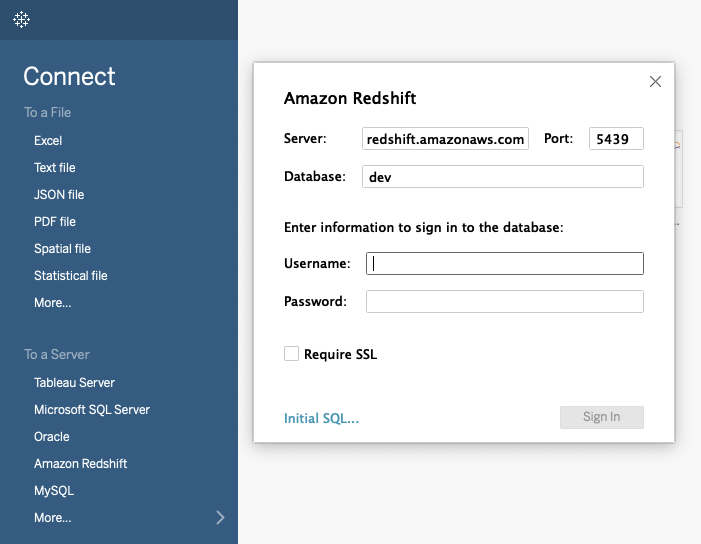
Tableau can connect to BI Connect through an Amazon Redshift connector. Please select this option and enter the DB credentials you've been given.
Once signed in, you can select the reporting schema to see a list of tables.
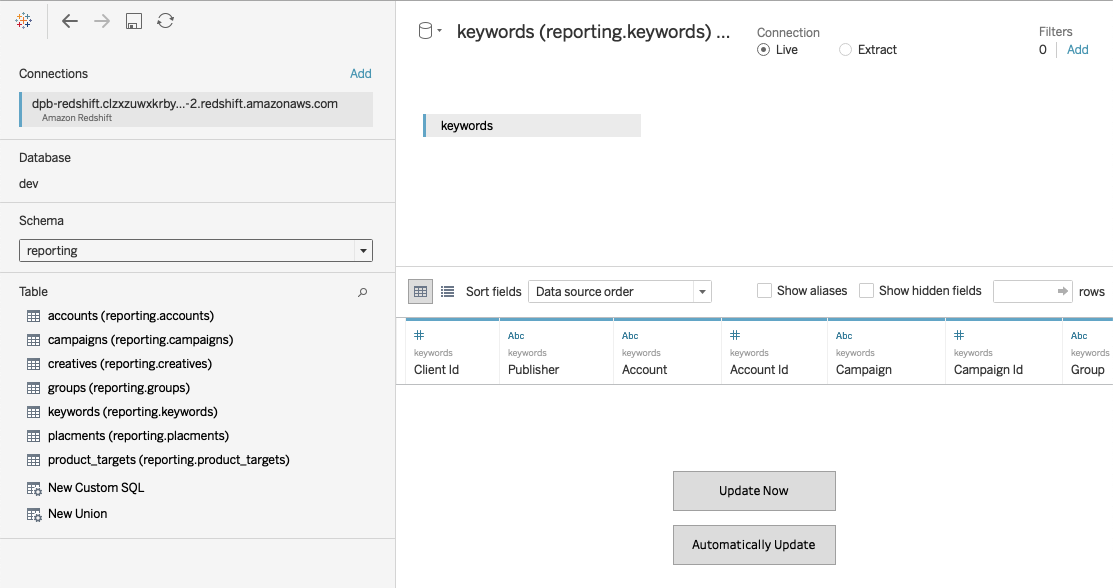
Drag and drop the table that you want to create your report from. Then, you'll see a list of fields available.
Tableau will bring in all rows from that table (all objects with their entire metric history).
Please note that this action is considered a Live Connection to Tableau and each drag of a table will send a new query to BI Connect. If speed becomes a concern, please consider using Extracts in Tableau, as this will speed up the resulting output.
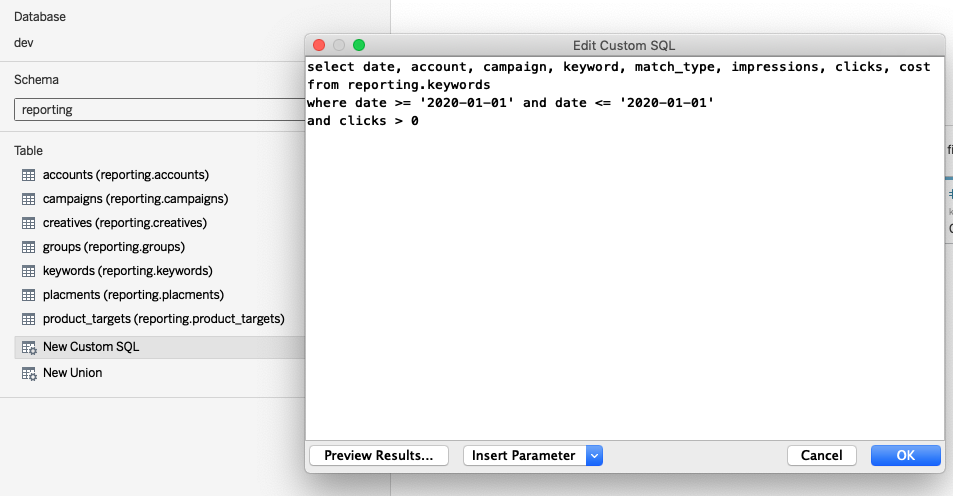
If you want to limit the fields or rows your bring in, you can specify a New Custom SQL. This is our recommend approach when connecting BI Connect to Tableau.
Google Data Studio
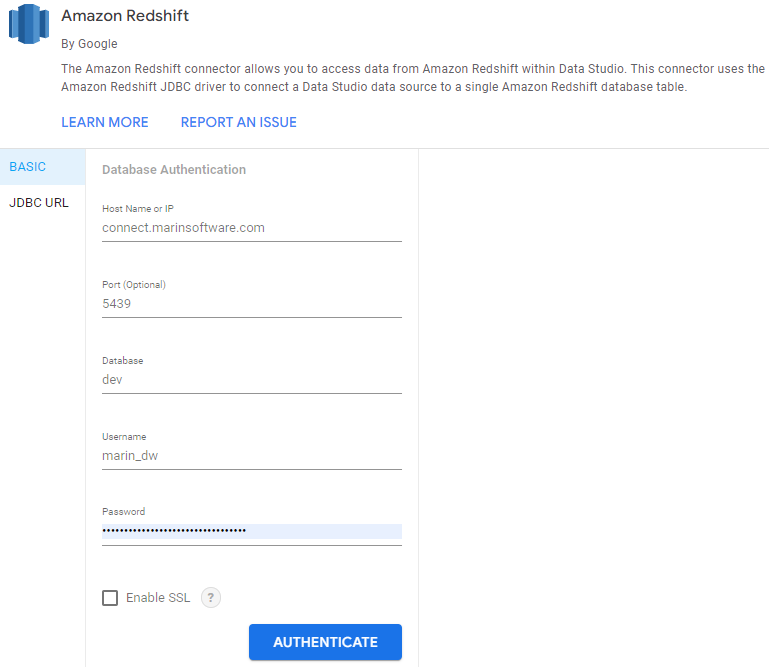
Google Data Studio can connect to BI Connect through either the Amazon Redshift or PostgreeSQL connector. Please create a new data source select the connector, and enter the DB credentials you've been given.
Once authenticated, please choose the Custom Query option. Google Data Studio is not able to bring in data with the Tables option, as these tables don't reside in the public schema. For instance, if you wanted to bring in the groups table, you can supply the following query:
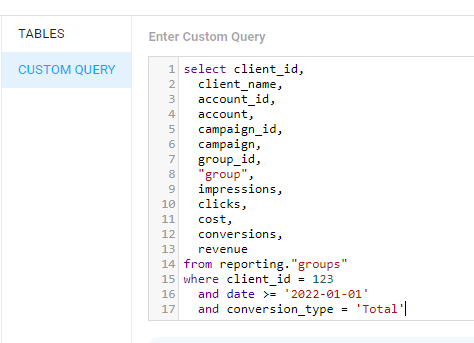
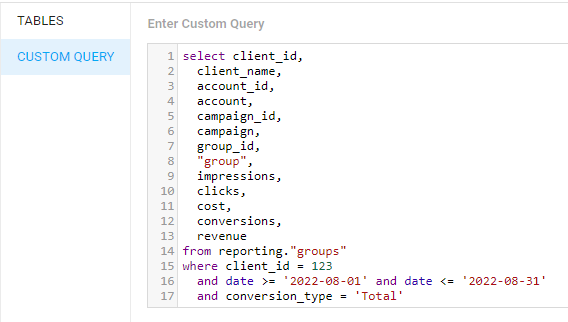
With the above query, Google Data Studio will bring in only the specified rows from that table for the set time period. If you want to limit the fields or rows further or include a specific time period, you can include additional constraints in your query. See the image below as an example.
Using Custom Queries
Unless you want to bring in all data (with all columns) for all time for a particular object type, you should use your BI Tools custom query import features to only bring in the data you need. This will make things faster to import and work with your BI tool, as the relevant data set will be smaller.
If you only cared about cost metrics from keywords with clicks for July 2022, you could write:
select account_id,
              account,
              campaign_id,
              campaign,
              group_id,
              group,
              keyword_id,
              keyword_pub_id,
              keyword,
              keyword_match_type,
              impressions,
              clicks,
              cost
            from reporting.keywords
            where client_id = 123
              and date >= '2022-07-01' and date <= '2022-07-31'
              and clicks > 0
Cost and Conversion Metrics
Cost and conversion metrics are stored in the cloud warehouse in a different format from what you would see those same metrics in Marin. For instance, here is a keyword with two conversion types, Sales and Leads, both of which are adding to Total Conversions and only one of which is adding to Total Revenue.
| Keyword | Impressions | Clicks | Pub Cost | Conversions | Revenue | Sales Conv | Sales Revenue | Leads Conv | Leads Revenue |
| baseball bats | 2500 | 550 | 125.30 | 65 | 400.00 | 45 | 400.00 | 20 | 300.00 |
In Marin, conversion types are added to their own columns (e.g. Sales Conv, Sales Revenue) and there are additional columns to show total conversions and revenue (e.g. Conversions, Revenue).
In the cloud warehouse tables, we include a Conversion Type column with separate rows for each conversion type. The above data would look like this in the cloud warehouse:
| keyword | impressions | clicks | cost | conversion_type | conversions | revenue |
| baseball bats | 2500 | 550 | 125.30 | Total | 65 | 400.00 |
| baseball bats | Sales | 45 | 400.00 | |||
| baseball bats | Leads | 20 | 300.00 |
A few things to note:
- Cost metrics are only present in the Total conversion type row. This row will contain both Total Conversions and Total Revenue.
- We have separate rows for each individual conversion type. These rows don't have cost metrics defined. This is so that if you sum these rows for this particular keyword, the cost metrics will be correct.
- You should not sum the conversion and revenue fields without taking into account the conversion_type column. Otherwise, you could get a summed conversion and revenue amount higher than Total Conversions and Total Revenue.
If you don't need to bring in all conversion types, you can limit this with the import query from your BI tool. For example:
select keyword_id, keyword, impressions, clicks, cost, conversions, revenue
            from reporting.keywords
            where client_id = 123
              and conversion_type = 'Total'
              and date = '2020-01-01'
This will only bring in total conversions and revenue. If you are bringing in other conversion types, make sure you bring in the conversion_type column as well.
select keyword_id, keyword, impressions, clicks, cost, conversion_type, conversions, revenue
            from reporting.keywords
            where client_id = 123
              and date = '2020-01-01'
If you want to view the conversion and revenue for a specific conversion type as columns, you would need to include the specific conversion type(s) in a case statement. See the following example:
select
              keyword_id,
              keyword,
              sum(impressions) as "impressions",
              sum(clicks) as "clicks",
              sum(cost) as "cost",
              sum(case when conversion_type = 'conversion_type' then conversions end) as "output_column Name Conv",
              sum(case when conversion_type = 'conversion_type' then revenue end) as "output_column Name Rev"
            from reporting.keywords
            where client_id = 123
              and date = '2020-01-01'
            group by 1,2
Dimensions
Most tables have a dimension column that stores all dimensions defined for that object in JSON format. For instance, we could have a campaign with the following dimensions:
| campaign | dimensions |
| My first campaign | { “brand”: “brand”, “category”: "shoes } |
In this case, we have two dimensions defined for this object, category and brand, with their respective values.
We could have a keyword within this campaign that adds a new dimension and redefines a parent object's dimension value. Look at the keywords table, you would then see:
| keyword | campaign | dimensions |
| boots | My first campaign | { “brand”: “non-brand”, “category”: “shoes”, “type”: "sale } |
This keyword has inherited its parent campaign dimension (category), redefined a parent dimension (brand), and added a new dimension (type).
Additionally, you can parse out specific dimensions from the dimensions column with a helper function. The helper function is:
function reporting.get_dimension_value(<dimension_column>, <dimension_name>)So, to get brand, category, and type dimensions from the keywords table in their own columns, you would write:
select keyword_id,
              keyword,
              match_type,
              reporting.get_dimension_value(dimensions, 'brand') as brand,
              reporting.get_dimension_value(dimensions, 'type') as type,
              reporting.get_dimension_value(dimensions, 'category') as category,
              impressions,
              clicks,
              cost
            from reporting.keywords
            where client_id = 123
              and date = '2020-01-01'
A few things to note:
-
Rolled up metrics by dimension using the keywords table might not match the dimensions tab in Marin. When we say ‘rolled up,’ we mean a query like the below:
select reporting.get_dimension_value(dimensions, 'brand') as brand,
              	  sum(clicks) as clicks,
              	  sum(conversions) as conversions
            from reporting.keywords
            where client_id = 123
              	  and date = '2020-01-01'
            group by reporting.get_dimension_value(dimensions, 'brand')
This is because Marin also includes non-keyword objects (such as product targets, etc.) in its dimension roll ups. If you are querying the keyword table in the cloud warehouse, you will only be rolling up at the keyword level.
Available Columns
For a list of the available columns for BI Connect, check out our Integration Guide documentation and navigate to the Appendix: Tables and Available Columns section in the left-hand document outline.
Next Steps
To learn more about BI Connect, to get started, or to find out about the cost of accessing the warehouse, please reach out to a platform representative.
