Introduction
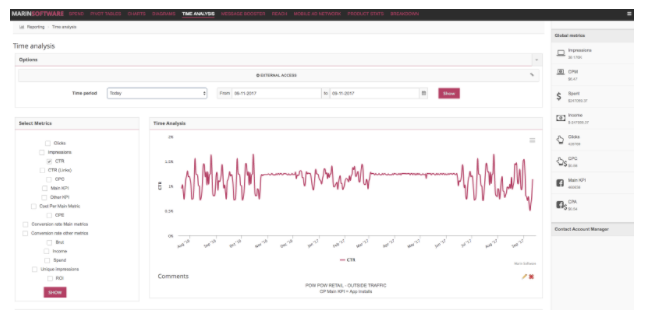
The Time Analysis tab allows you to analyze your campaign performance over a given period of time. You can also evaluate best performing time slots, which is extremely useful for determining whether Custom Scheduling is a suitable strategy for your campaigns.
To access the Time Analysis:
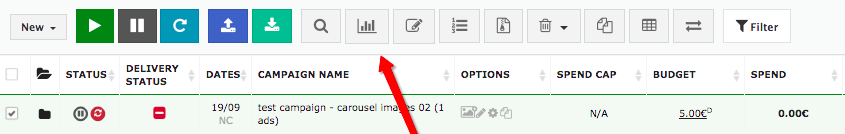
- Go to the Campaign level.
- Select the campaign.
- Click on the Reporting button above the grid to go to the Reporting Interface.
- Select Time Analysis from the navigation panel above the grid.
Step-By-Step
Follow these steps to create your Time Analysis report.
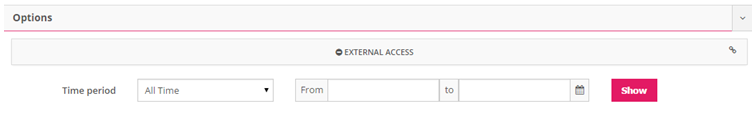
- Select a Time Period.
- Choose the metric you would like the platform to analyze.
- Then click Show.
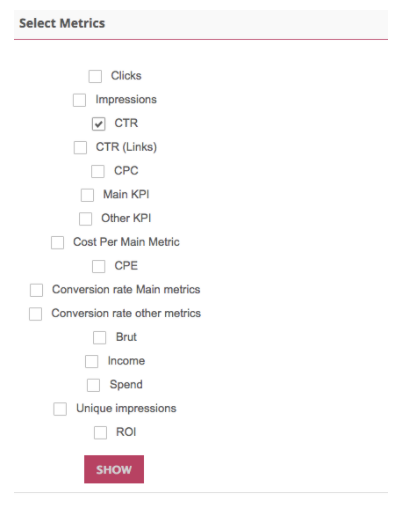
Common Analysis Metrics
Below you'll find definitions for some of the most commonly used Time Analysis metrics.
- Clicks: The number of clicks your ads received.
- Impressions – Times a user is served a Tweet in timeline and/or search results.
- CTR – Click through rate (ratio of clicks to impressions).
- CPC – Cost per click.
- Main KPI – The number of Main KPI acquisitions generated (fans, app installs, leads – depending on what you have chosen as a campaign target).
- Other KPI – Other KPIs configured in the Media Plan dashboard
- Cost Per Main Metric – cost per Main KPI acquisition.
- CPE – Cost Per Engagement.
- Brut – Gross revenue.
- Income – Net revenue.
- Spend – Media spend.
- ROI – Return on Investment.
Analysis Chart Examples
Analysis By Date
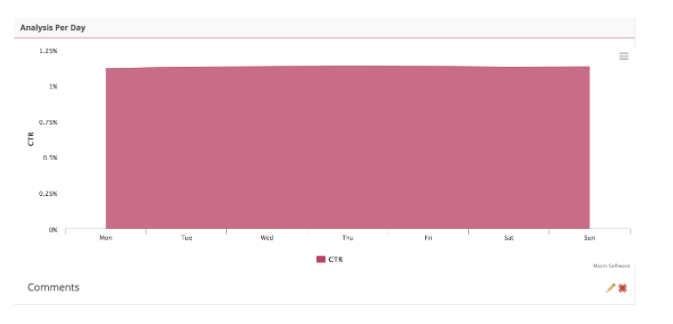
Analysis Per Day
External Access
To share a link with an external user, follow these steps:
- Select the language you want the postponement external access to appear in.
- Choose the Time Period of the deferral.
- Click Share to see the link.