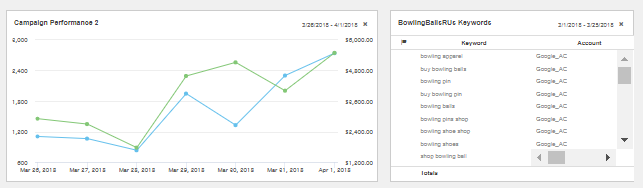
Marin's Dashboards give you quick access to the data you use most frequently. Think of the Dashboard as your personal command center, with metrics, data, charts, and more, right at your fingertips, customized to meet your unique business needs.
For example, you may want to immediately see the keywords that have had a significant increase in clicks, you can add this data to your Dashboard so it's the first thing you see when you log into Marin. Or perhaps it's important to your business to see if impressions have dropped for key ads so you can maximize your coverage. No matter your need, you can create a flexible, actionable visualization of your data across campaigns and across channels.
Handy Tip
Dashboards are built on top of Saved Views, so before you get started building out your Dashboard, we recommend checking out our Saved Views article. Save a few views that you'd like to be included in your Dashboard, then get started creating your Dashboard.
Overview
Marin's Dashboards bring together views from different grids and channels from across the platform Data. You can create multiple Dashboards for different uses or audiences. Your primary Dashboard is available under Overview > Home. Additional Dashboards are found under Settings > Dashboards.
Unlike Saved Views, Dashboards are not tied to the tab where they were created, so Dashboards allow you to unite all of your data from across Marin so you can see all of your most relevant data from a single spot. If you use Marin Social, you can even pull cross-channel data into the same Dashboard.
Note: If you make edits to your Saved Views, these will also be rolled out to all Dashboards to which your Saved View has been added. Check out the Editing a Saved View section of our dedicated article to learn more.
Creating, Editing, & Deleting Dashboards
Creating Dashboards
- Navigate to Dashboards Manager by clicking on Settings > Dashboards in the upper right corner of the screen. This is where you'll set up, manage, and edit all of your Dashboards.
In the Dashboard Manager, you can configure details associated with each Dashboard component, including its size and placement, as well as adding or removing components.
Note: we recommend setting up your Saved Views prior to setting up your Dashboard. If you have not yet saved any views, check out our Saved Views article to learn how. - To create a new Dashboard, click Create ('plus sign' icon).
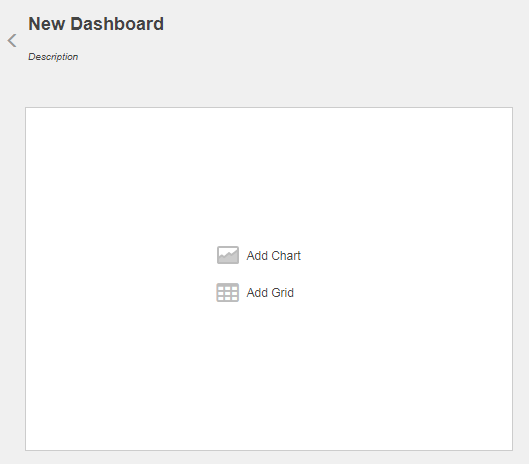
- You can name your Dashboard simply by clicking into the default text, selecting it, and typing in your Dashboard's new title. Similarly, you can add an optional Description.
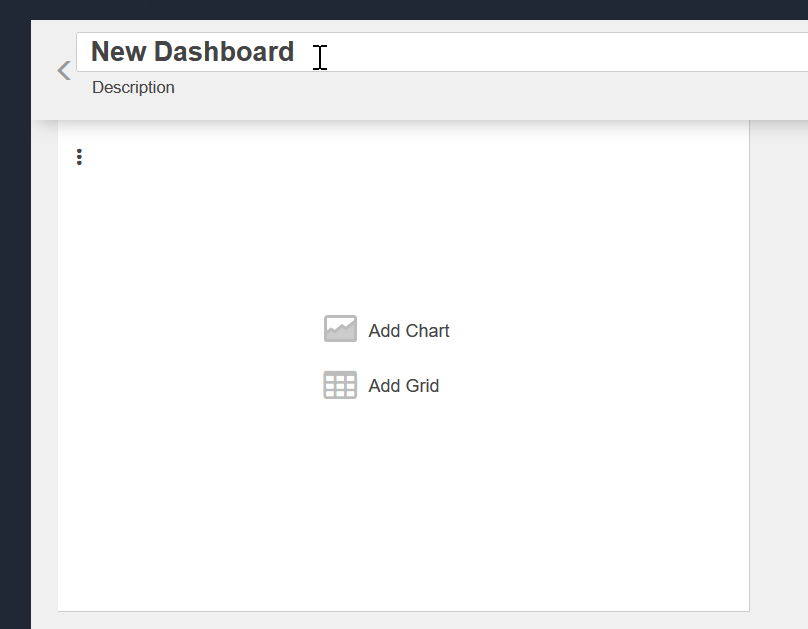
- Next, click into your first component and select either Add Chart or Add Grid, depending upon what type of data you'd like to bring into your Dashboard. You'll have an opportunity to add additional Dashboard components later on, so if you need both chart and grid data, simply select either option to get started.
- Next, you'll be able to select between existing Saved Views. Click My to see Saved Views that you have created or click Shared to see Saved Views that have been shared with you (or Saved Views you have created and saved with others). The Marin button will allow you to create a Dashboard from views have been created by members of the Marin team and shared globally. These can serve as a good baseline or starting point if you have not yet created Saved Views that are unique to your business.
Remember that you can use the Search feature to search among your existing Saved Views. The name will include the grid and channel used when your Saved View was created following the format of Channel > Tab > Saved View Name.
Select the desired Saved View and click Load.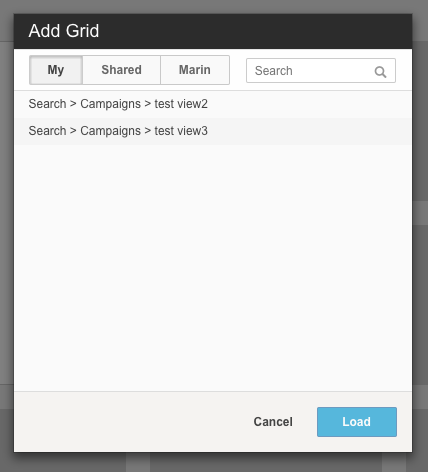
- If the selected Saved View doesn't have any data, you will see the message "0 Results Found" in your Dashboard once you've loaded it. Consider revising your time period, filters, or the scope of your Saved View.
- Each component within your Dashboard can be moved or resized according to your needs. Keep in mind that the component's contents (as well as other nearby components) will shift depending on the size selected.
You can use the gray rectangles as a guide for general sizing of each component. For example, you might find that one component looks best 3 widgets wide and 2 widgets high while another looks best 2 widgets wide and 2 widgets high. Test out different sizes to find the perfect size for your chart or grid. - You can make on-the-fly changes to each component's name, metrics, comparison metrics,
columns (for Dashboard girds), filters (for Dashboard grids), and date range. These updates will also edit the underlying Saved View.
The Compare toggle, when switched on, shows the comparison between two date ranges. For grid components, you can also sort columns in addition to applying filters.
Note: Currently, not all types of charts support on-the-fly edits. If you notice a chart that cannot be edited, you will need to apply edits to the Saved View that was used to create your chart, rather than applying your edit to the Dashboard chart directly. - Once you've imported your first Saved View into your Dashboard, you can additional Saved Views by selecting Add Chart or Add Grid again, as many times as you need in order to configure the Dashboard for your needs.
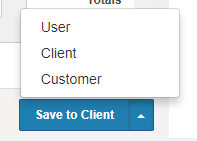
- Once your Dashboard components have been configured to your liking, you can save your Dashboard to the User, Client, or Customer level. Use the matrix below to learn more about Dashboard Permissions.
| Dashboard Permission Level | Definition |
| User-Level Dashboards | Personal Dashboards for your own reference, only visible to yourself. |
| Client-Level Dashboards | Accessible to anyone who has access to your Marin Client Account |
| Customer-Level Dashboards | Accessible to anyone within your organization who has access to Marin, whether or not they have access to this specific Marin Client Account. |
Use the drop-down in the bottom right-hand corner to select the level at which your Dashboard will be saved. This button's name will change depending upon the level where your Dashboard has been set, so when you're ready to save, click the button that says either Save to User, Save to Client, or Save to Customer.
Note: Don't forget the permissions of your Saved Views as you set the permissions for your Dashboard. For example, you wouldn't want to use a Saved View that's visible only to yourself in a Dashboard that's accessible to everyone who can access your Marin Client Account, but it's fine to use personal Saved Views in personal Dashboards.
Editing Dashboards
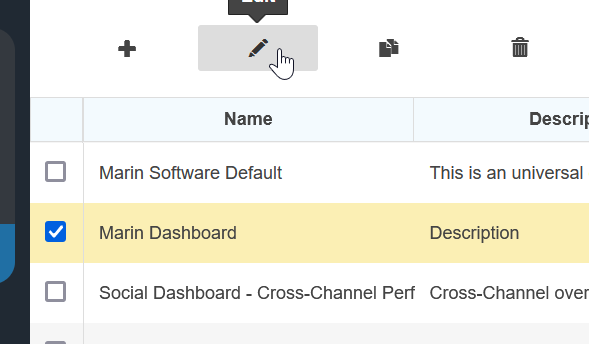
- Next, navigate to Dashboards Manager by clicking on Settings > Dashboards in the upper right corner of the screen.
- Select the check-box next to the Dashboard you'd like to edit and click the Edit button ('pencil' icon).
- From this point on, you can configure changes to your Dashboard in the same way described in the Creating Dashboards section above. You can even make on-the-fly changes to your each component's name, metrics, comparison metrics, columns (for Dashboard girds), filters (for Dashboard grids), and date range. These updates will also edit the underlying Saved View.
The Compare toggle, when switched on, shows the comparison between two date ranges. For grid components, you can also sort columns in addition to applying filters.
Note: Currently, not all types of charts support on-the-fly edits. If you notice a chart that cannot be edited, you will need to apply edits to the Saved View that was used to create your chart, rather than applying your edit to the Dashboard chart directly.
You can edit all Dashboard components simultaneously, meaning you won't need to save each individual component separately. You can save all at once for the Dashboard as a whole.
Save your changes by selecting either Save to User, Save to Client, or Save to Customer, in the bottom-right, depending on your needs.
If your Saved Views are saved at the User level and added to a Dashboard, you won't have the option to save the Dashboard at the Customer level. If your Saved Views are saved at the Customer level, then added to a Dashboard saved at the User level, afterward, you won't be able to save that Dashboard at another level anymore. However, you can still duplicate the Dashboard and save the copy at the Customer level.
Deleting Dashboards
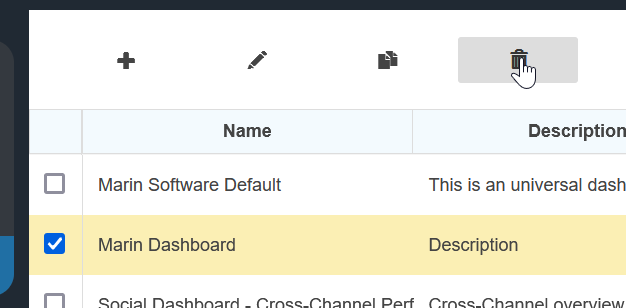
- Navigate to Dashboards Manager by clicking on Settings > Dashboards in the upper right corner of the screen.
- Select the check-box next to the Dashboard you'd like to delete and click the Delete button ('trash can' icon).
- You will then be asked if you are certain you would like to delete. Click Yes to proceed.
Copying Dashboards
If you have an existing Dashboard that you'd like to copy, you can do so by following the steps below.
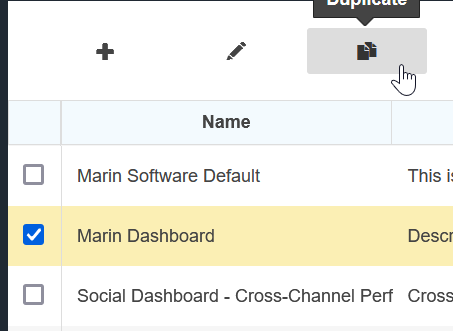
- Navigate to Dashboards Manager by clicking on Settings > Dashboards in the upper right corner of the screen.
- Select the check-box next to the Dashboard you would like to copy.
- Click on the Duplicate icon above the grid. This is the icon that looks like two sheets of paper.
- You can make settings changes to the copied dashboard, like adding widgets or changing the name, description, or shared level. To edit the widgets, please save a copy first.
- After that, you'll have an opportunity to configure your newly-copied Dashboard as-needed, just like you would with a brand new Dashboard. Update your charts and graphs, give your Dashboard a new name, and select either Save to User, Save to Client, or Save to Customer, depending on your needs
Setting Your Default Dashboard
You will see your default Dashboard under Overview > Home in the left navigation. You should include all of your most relevant day-to-day data in your default Dashboard in order to leverage it to its fullest potential.
You will see a Dashboard in your account called Marin Software Default. This Dashboard will be your default until you choose to manually update your default Dashboard. This Dashboard is not editable, so you may find it beneficial to create your own Dashboard and save it as the default to allow for future edits. If, however, you'd like to use this Dashboard as a starting point for your own Dashboard, you can copy it using the Copying Dashboards instructions listed above.
You can set your default Dashboard by following the steps below.
- Select the check-box next to the relevant Dashboard and click on the Primary View button ('heart' icon).
- From here, you can choose whether you would like this Dashboard to be the default at the User, Client, or Customer level. See the definitions listed in step 9 of the Creating and Editing Dashboards section above to learn more about what these permissions mean.
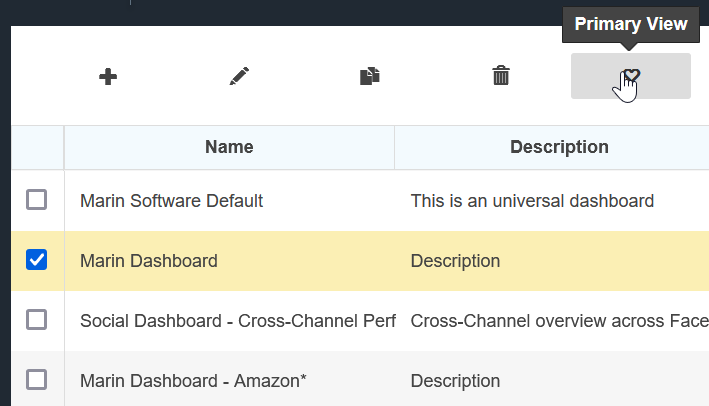
- Once you've selected the level at which to set your default settings, click Save. If you decide later that you'd like a different Dashboard to be your default, you can always come back and reset your default.
Viewing Your Dashboard
You'll be able to view your Primary Dashboard immediately when you log into Marin, but to navigate there directly, you can follow the steps below.
- Next, navigate to Dashboards Manager by clicking on Settings > Dashboards in the upper right corner of the screen.
- Here you will see a list of available Dashboards. To view one, simply click on it and it will open in a new tab.
- To make edits directly to your dashboard, click the Edit button and follow the instructions outlined in the Editing Dashboards section above. Please note that you will not be able to make edits to your Dashboard from the Home tab.
Sharing Your Dashboard
Marin's Dashboards can be shared with colleagues and clients, even those who may not have access to Marin or any of Marin's other platforms. To share your Dashboard, simply follow the steps below.
- Navigate to Dashboards Manager by clicking on Settings > Dashboards in the upper right corner of the screen.
- Next, select the check-box next to the relevant Dashboard and click on the Share button ('arrow' icon).
- From here, you have the option to copy a shareable link or add an email address to send this Dashboard to your colleagues immediately. Click the Copy Link button to save the link to your clipboard or input the applicable email addresses and click Send. You'll be then asked for confirmation -- simply click Yes to finalize your email.
