Introduction
With Marin Social's charts, you can view your best and worst performing ads based on different KPIs. See which ads generated the most impressions, clicks, leads, etc. Which ad has the best click through rate, number of conversions, etc.
Step-By-Step
You can create charts quickly and easily with Marin Social. To do so, follow these steps:
- Choose your Time Period.
- Select whether you'd like to view your Best ads or Worst ads.
- Define your Search by metric to determine how you would like the platform to rank your ads.
- Select your See top metric. This is the number of ads you would like the platform to rank.
- When you're ready, click Show.
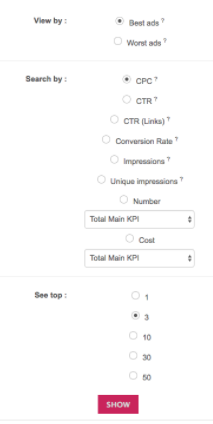
Chart Options
View by: Performance – best / worst performing ads.
Search by: Different KPIs you can choose from to rank your ads.
- CPC – Cost per click.
- CTR – Click through rate (ratio of clicks to impressions).
- Impressions – Times a user is served a Tweet in timeline and/or search results.
- Number Total Main KPI – The number of Main KPI acquisitions generated (fans, app installs, leads – depending on what you have chosen as a campaign target).
- Cost Total Main KPI – cost per Main KPI acquisition.
See top: Number of ads you would like to rank.
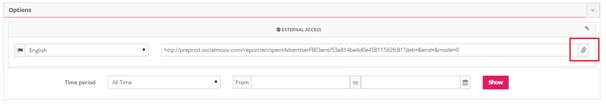
External Sharing
To share a link with an external user, follow these steps:
- Select the language you want the postponement external access to appear in.
- Choose the Time Period of the deferral.
- Then click Share.
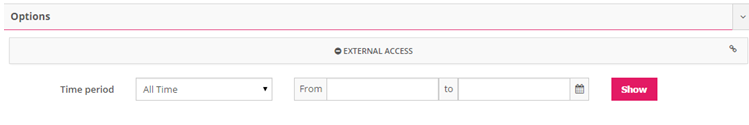
- You can also view the report in a new tab, by clicking on thelink icon below.