Introduction
The Diagrams tool is a great way to visually cross-analyze campaign performance. You'll find a link to the tool in the main navigation at the top of the platform.
Step-By-Step
To create a report using the Diagrams tool, follow these steps:
- Click Diagrams in the main navigation.
- Select a Time Period.
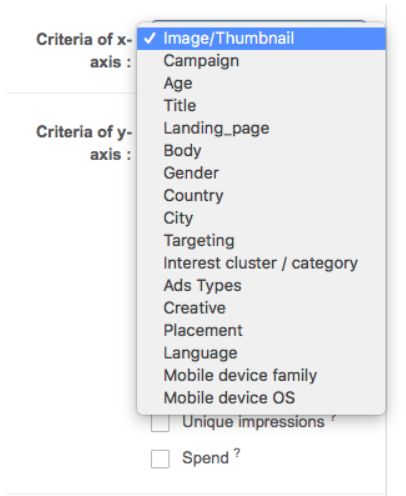
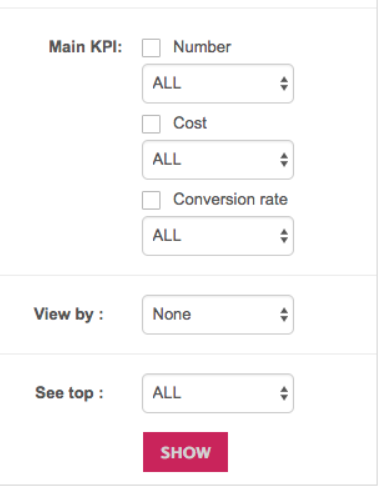
- Choose the metrics you would like our platform to analyze your ads based on. You can select the criteria of both axes.
- Click Show.
Example
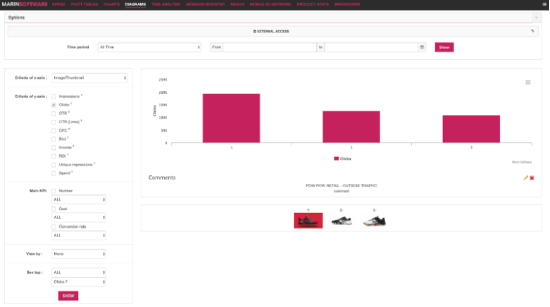
- X-axis > Image
- Y-axis > Clicks
- Time period > All time
- See top > 10
Note: The platform shows diagrams with images’ performance. You can see the exact number of clicks for each picture by hovering over each bar.
External Access
You can send this URL to clients so that they can access the reporting interface by following these steps:
- Select the language you want the external access report to appear in.
- Choose the Time Period of the report.
- Click Share to see the link.

