The History Reporting feature in Marin is a handy (and fast) way to access performance data for any of your objects. Even better, History Reporting offers you a quick and easy way to troubleshoot issues, identify trends, break down data by day, and more.
How To Access History Reporting
The History Tab
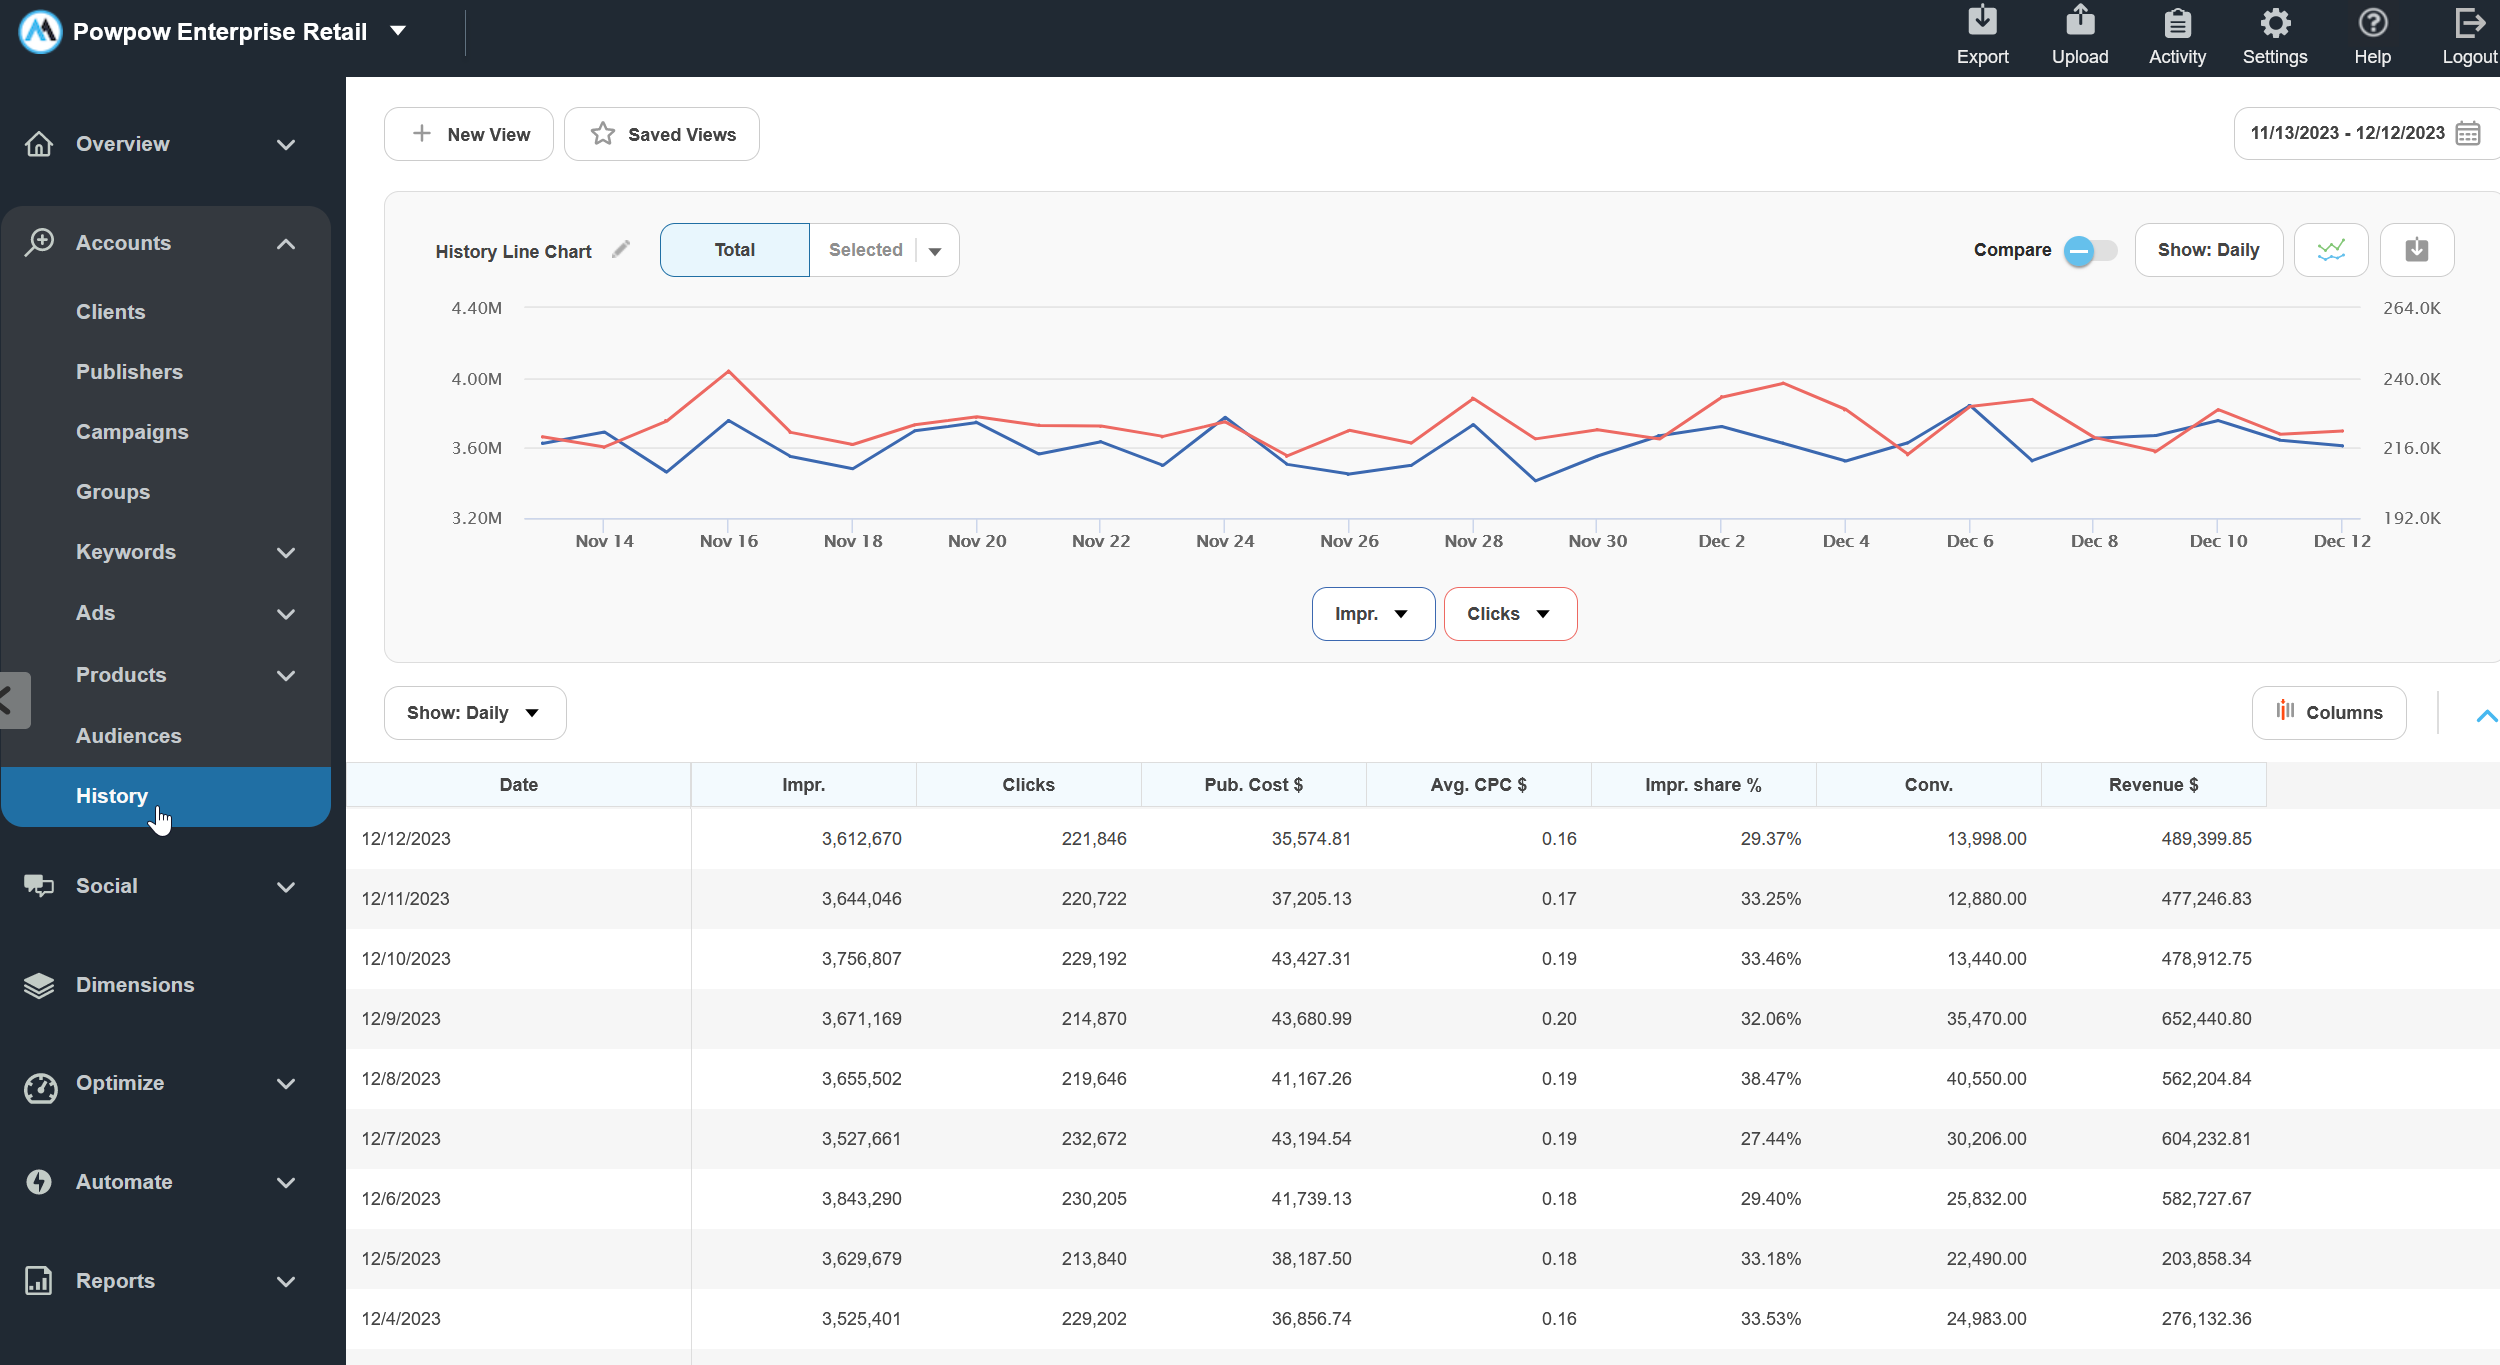
You can access at-a-glance oversight of all of your Client Accounts from the main History tab, accessible from the left-hand navigation menu.
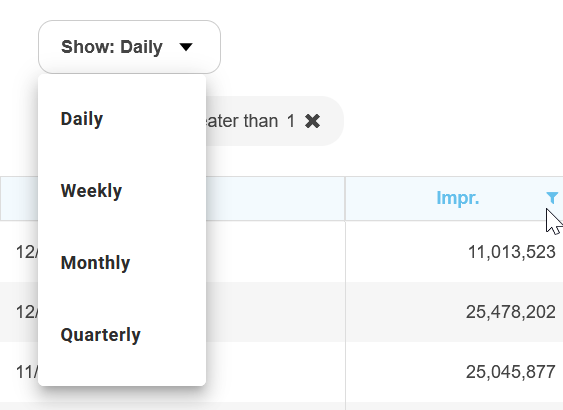
From here, you can adjust your date range using the Calendar Range above the grid and adjust the data roll-up by day, week, month, or quarter.
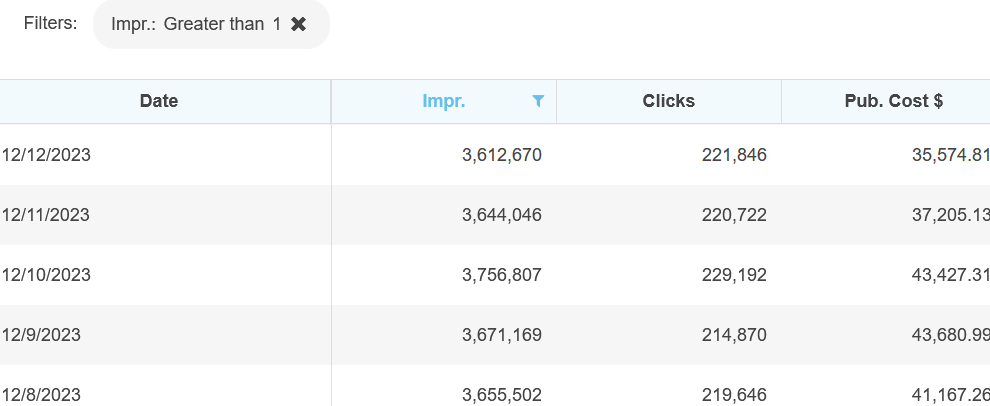
You can even apply additional filters by clicking into the funnel icon above each of the columns.
History For An Individual Object
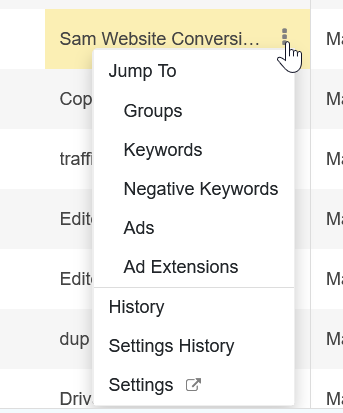
History Reporting is also available from any of the main grids by simply hovering your mouse over the object's title and clicking on the 'More' menu ('three dots' icon).
From here, select History to visit the History tab for this specific object.
To learn about the other features available from the 'More' Menu, check out our dedicated article.
The History Reporting Grid
Once you've clicked on the History Reporting button for the relevant object row, you'll be presented with a dedicated grid for that object featuring key metrics such as Impressions and Clicks. This is the History Reporting grid.
Of course, you can also use the platform's Column Selector to add or remove the metrics columns as required -- and use the Date Selector to refine the date range for the data shown in the grid.
Important Notes
Below are a few things to bear in mind when working with History Reporting in Marin.
- If you're a Marin Social user, you can also use History Reporting with your Social accounts.
- In a future update, we'll be adding the ability to break down your data by device. Watch this space for updates!
