The Budgeting tools in Marin provide both a budget Pace tool and a budget Plan tool to help you plan and optimize your monthly budgets. The Pace tool allows you to forecast your publisher spend for the current month, while the Plan tool summarizes various spend targets and the corresponding KPIs (Key Performance Indicators) for the current month.
You can find these features by navigating to the Optimize tab in the left-hand navigation, clicking on Strategies, selecting a single strategy in the grid, expanding the chart (if not already expanded), and selecting “Pace” chart in the drop-down of available chart types.

Please note that in this article, we'll be talking about Budget Optimization. For information on Strategy forecasting for non-budget related metrics, check out our Strategy Forecasting article.
Handy Tip
Note: In Marin, this feature is currently in beta testing and may not be available in your Marin Client Account. If you are interested in testing this beta feature, please reach out to your Marin platform representative.
If you are not yet opted into the beta test for this feature, you will still be able to see the Forecasting toggle, but the data will be unable to load.
The Benefits Of Budget Optimization
Here's why this feature can be very handy as an advertiser:
- You can see a forecast for how much you will spend during the current calendar month.
- The forecast takes day of week and day of month seasonality into account when generating a forecast
Pace
The Pace tool allows you to view projected, actual, and cumulative advertising spend for the current month, the current week, and the current quarter, including partial same-day spend and forecasting for the remainder of the day. You can also view projected spend for the next month and the next quarter.
How To
You can access the Pace tool by following the instructions below.
- Navigate to the Optimize tab in the left-hand navigation.
- Next, select the Strategies sub-tab.
- Select a single strategy in the grid
- From here, expand the chart above the grid (if not already expanded) and select “Pace” chart in the drop-down of available charts.

- From here, select the Pace button above the chart.
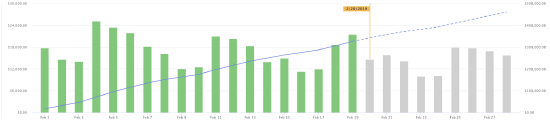
For details on Strategy Forecasting, check out our dedicated article. - The bar charts show daily spend for the current month, with green representing actual spend and gray representing forecasted spend.
The line chart represents cumulative spend, with the solid line showing actual cumulative spend and the dashed line showing forecasted cumulative spend.
You can see examples of both Actual Spend and Forecasted Spend in the screenshots below. Hover over any day in your chart to learn more about spend for the selected date.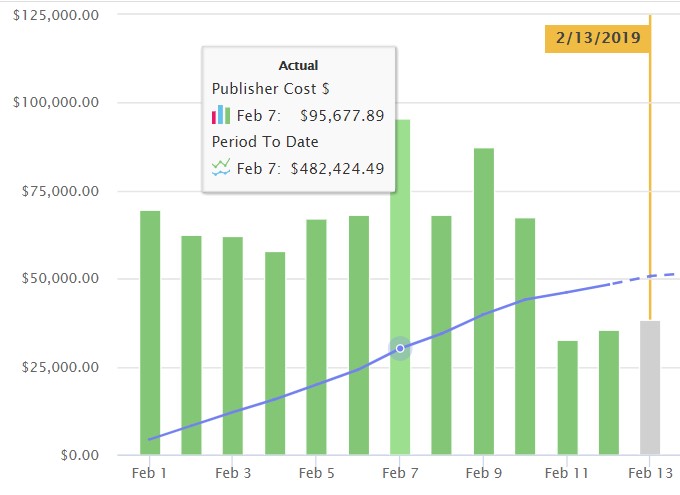
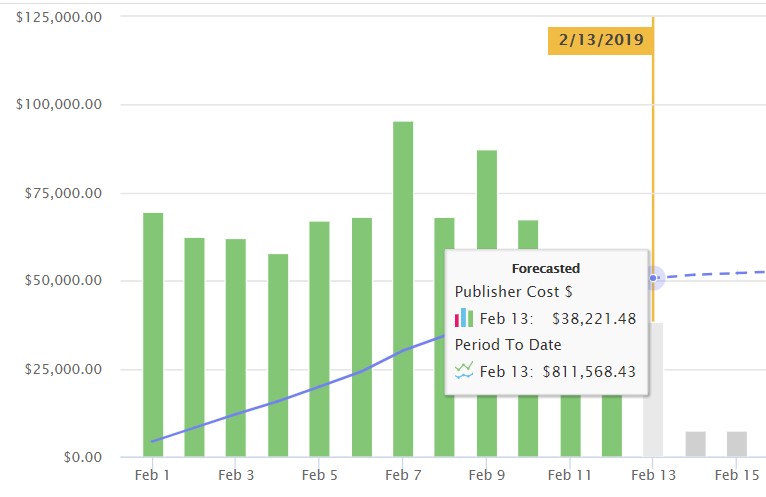
You can also see a key for your bar and line charts at the left of your Pace dashboard.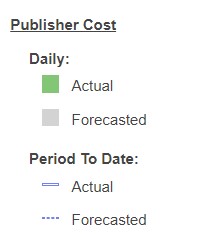
- From your Pace dashboard, You can even export the forecast chart to one of your cross-client, cross-channel Marin dashboards if you wish. To do this, simply save it as a Saved View, then add it to a dashboard. For more information about dashboards, check out our dedicated article.
How It Works
The Pace tool forecast first calculates the base prediction using a recency-weighted 90 day look-back window. For even more precision, the feature also takes into account known temporal effects such as day of week, day of month, month of year and day of year seasonality. This requires at least 3 data points for each seasonal effect. If a significant effect is found, it is filtered out of the data before the next check, to avoid double counting.
Plan
The Plan tool allows you to visualize the allowable spend targets for the current month while also providing clarity on secondary metrics or KPIs, such as clicks, conversions, or gross profit.
Please note: The Plan tool is only compatible with Search Strategies targeting a Financial Goal. It is not compatible with Awareness Targeting Strategies.
How To
You can access the Plan tool by following the instructions below.
- Follow steps 1 through 4 in the instructions listed above for the Pace tool.
- Next, select the Plan button above the chart.
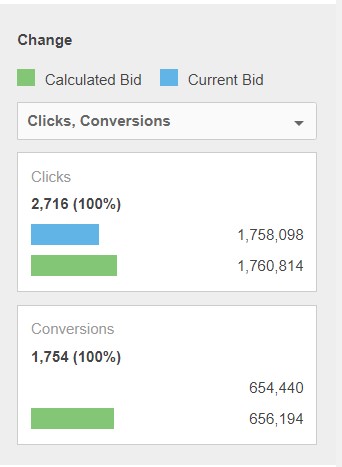
- The chart's x-axis represents the monthly spend target range, the y-axis the secondary KPI. The chart is interactive and allows you to see the current spend, which can be toggled via the slider. This updates the spend target on the chart and bar charts showing current and recommended metrics.
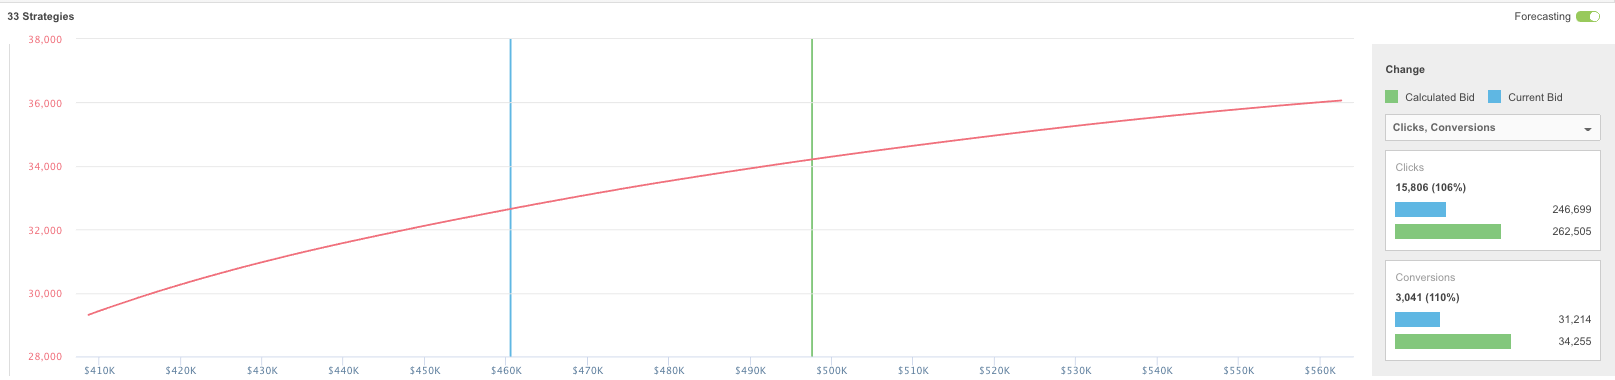
- At right you can adjust your secondary KPI. Choose between clicks, conversions, gross profit, profit, and publisher cost. The blue bar represents how your secondary KPI are performing based on your current bids. The green bar represents how your secondary KPIs will be impacted based on the changes you're thinking of making to your spend target. Think of the blue bar as today and the green bar as tomorrow -- if you execute the change you're thinking of making.
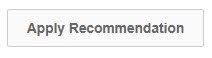
- Click Apply Recommendations to target your new spend goal. Marin Bidding will adjust your Strategy targets accordingly in order to reach your new spend goal.
How It Works
Exploring spend target scenarios via Plan triggers a Spend Reallocation algorithm that takes as input Strategy forecasting data points, target KPI and monthly spend goal defined in the drop-down menu of the Plan sub-tab to determine the optimal Strategies to allocate new spend to. The reallocation is then translated to new Strategy targets i.e. ROI, CPA, Margin. These new targets can be viewed in the Strategy grid reported under Recommended Target.
Note: Once you set your Strategy to Preview mode, it can take up to 24 hours for the Plan tool to populate with data. If the platform is unable to generate a forecast for a particular Strategy, then the Strategy will be omitted from the grid and will be represented as a static component in the overall Plan simulations.
A Note About Date Ranges
The platform's Budget Optimization feature allows you to select from a variety of calendar cycles, including: current week, current month, current quarter, and many more. By choosing a different date range, you'll gain a better understanding of how well your pacing is working. You can then adjust your goals based on the data provided by the platform's Plan simulations.
The 4-5-4 Calendar
The platform also supports the retail 4-5-4 calendar, although you'll need to speak to your platform representative to have this enabled for your account. When using 4-5-4, selecting the current month will reflect the 4 or 5 week of the 4-5-4 calendar month. Similarly, when selecting the current quarter, the selected date range will include the 13 weeks of the current 4-5-4 quarter. Learn more about the 4-5-4 calendar here (external link).
Important Notes
- Microsoft and Google Shopping Campaigns are supported with budget optimization tools.
- Currently, Dynamic Search Ads and Awareness Targeting Strategies are not supported by the Pace or Plan tools.
- Campaigns using Google Smart Bidding will not be forecastable. The spend graph will be accurate, but the tool will be unable to forecast performance changes.
- The Pace tool uses the data from across your account to generate its forecasts, rather than the data from active Strategies only.
- Budget Plan reports on allowable spend for the entire account, however, the spend reallocation only applies to Search and only to Non-Positio Strategies set to Preview or Traffic mode.
Spend reallocation modifies Strategy targets. Campaign budgets are not changed.
The reallocation will only apply to Strategies set to Traffic mode when Apply Recommendations is clicked.
Changing Strategy constraints will disable Apply Recommendations until the next spend reallocation engine cycle, which runs every morning at 9:30am local time.
