Track progress against your targets with Pacing Columns. This powerful visualization shows where you are today and where Marin forecasts you will be at the end of the episode. The pacing charts (also sometimes affectionately known as pacing “thermometers”), provide a quick visual representation of your strategies' performance against their targets. Users can see where they stand relative to their goals, whether it's spend targets, CPA (Cost Per Acquisition), or ROAS (Return on Ad Spend).
The pacing charts are available on both the Strategies and Campaigns grids. From these grids, they can be added to dashboard widgets.
The Pacing Columns will be for the parent Strategy in the Campaigns grid. This is a useful reference to how the collection is pacing without having to navigate to the Strategies grid and back.
Understanding the Pacing Chart Visualisation
Strategies with a Spend Target: The Pacing Columns will focus on monitoring and adjusting the spending. These columns will show how much has been spent so far, how the spending is progressing relative to the target, and any adjustments needed to stay on track with the spending goals.
Strategies with an Efficiency Target (CPA or ROAS): The Pacing Columns will focus on the efficiency metrics, specifically Cost Per Acquisition (CPA) or Return on Ad Spend (ROAS). These columns will show how well the campaign is performing to achieve the desired CPA or ROAS, and any adjustments needed to meet these efficiency targets.
Strategies with both a Spend Target and an Efficiency Target (CPA or ROAS): The Pacing Columns will focus on the spend pacing metrics. These columns will show how much has been spent so far, how the spending is progressing relative to the target, and any adjustments needed to stay on track with the spending goals.
The pacing visualization is in the ‘Pacing' column:
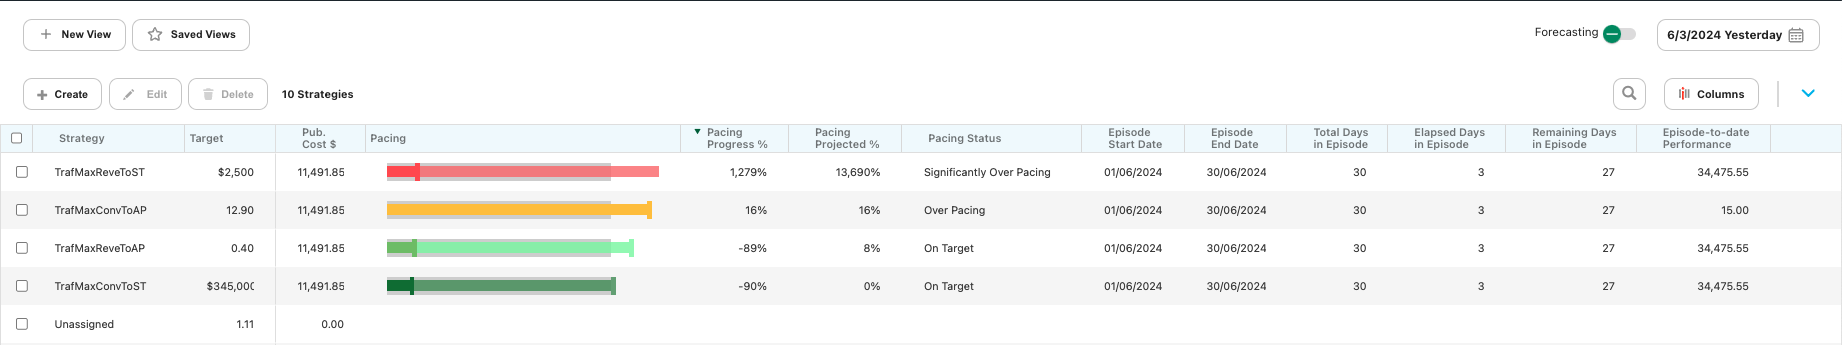
- The gray background bar represents the target
- The translucent colored bar represents forecast performance at the end of the episode based
- If the colored bar extends beyond the grey bar, we are projecting we will exceed the target
- The darker colored bar represents performance to date,
- The bar's color gives a visual indication of how far from the target the strategy is forecast to be. Dark green indicates on-target; dark red is very off-target.
In addition to the chart, the following pacing columns are available:
- Episode End Date
- Episode Start Date
- Elapsed Days in Episode
- Total Days in Episode
- Remaining Days in Episode
- Episode-to-date Performance (units are spend or efficiency, depending on the Strategy goal)
- Pacing Progress % (episode-to-date progress)
- Pacing Projected % (forecasted as a % of the Strategy target)
- Pacing Status
We also show the spend-weighted aggregate Pacing columns in the Totals row (available in the Strategies grid only), which provides a handy high-level summary across all episodic Strategies.

Requirements
- There are Strategies set up to an episodic goal.
- See Pacing Dashboard see for more details on how the Pacing Charts works
Adding the Pacing Columns
From the Strategies Grid or Campaigns Grid:
- Open the 'Optimize' navigation bar on the left.
- Click on the ‘Columns’ picker
- Navigate to the new ‘Optimize’ subsection
- Select the new columns, and click ‘Apply’
Additional Details
- Charts will not show unless there is at least 1 active campaign with spend in the current episode
- Supports any strategy with a Goal tied to an “episode” , including: Maximize Conversions or Revenue, Spend, or both.
- The metrics are for the current episode and are not connected to the date picker.
- If you wish to sort by pacing, sort by “Pacing Projected %” or “Pacing Status” columns instead
- For ROAS targets, lower values are the right. So over target means your ROAS is too low.
- If a Spend target is set, we will show pacing to that. If only an efficiency target is set, then we will show progress to that instead.
For any questions or further assistance, please reach out to our support team through the usual channels. Stay tuned for more updates on this feature.
