Apple's Safari browser was updated with the first version of Intelligent Tracking Prevention, or ITP. The first versions of this technology limited third-party cookie usage, reducing ad retargeting ability and some user tracking methods (for example, tracking via URL redirection).
From there, the ITP team enhanced the feature, releasing multiple new versions, meaning it now impacts genuine first-party cookies being set or accessed by on-site tracking tags (i.e. set using JavaScript). What does this look like in real terms? The result is that the latest versions of ITP are now forcing the expiration duration of these first-party cookies to just one day, or 24 hours.
Handy Tip
If you're not seeing the ITP Dashboard in Marin, please reach out to your platform representative or our Customer Support team to have it enabled.
The ITP Dashboard
We understand it's important for you as an advertiser to understand the impact of ITP on your conversion tracking. That's why we've built the Marin ITP Dashboard. This real-time analytics dashboard is available to all clients using Marin Tracker. If you're not already using it, you can reach out to your platform representative to install Marin Tracker free of charge. Once enabled for your account, you can find the ITP Dashboard by following these steps:
- Log in to Marin.
- Next, go to Settings > Revenue & Tracking in the top right corner.
- Then, select ITP Dashboard from the sub-navigation.
Provided you're using Marin Tracker, you'll see the ITP Dashboard and its various useful charts and metrics. You can visit this dashboard anytime to stay up-to-date with the effects of ITP on your performance. Below we'll describe what each of the sections of the ITP Dashboard represent and how to use them.
"Conversions At Risk" Chart
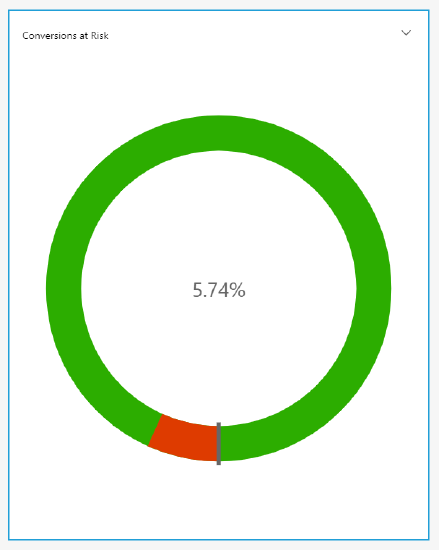
The first chart you'll see in your ITP Dashboard is the Conversions At Risk chart. In a nutshell, this chart shows you the exact percentage of your conversions which could be "dropped" (i.e. not properly attributed) if all of your Safari traffic were to have the latest ITP version applied to it with no preventative measures taken on your part.
The percentage is using conversion data collected by Marin Tracker in the last 30 days, and is calculated like so:
[% of your total conversions via Safari] * [% of conversions via Chrome which are driven by clicks older than 24 hours]
Note: The reason we use Chrome to calculate your conversion latency is that it's unaffected by ITP.
"Web Browser Market Share" Chart
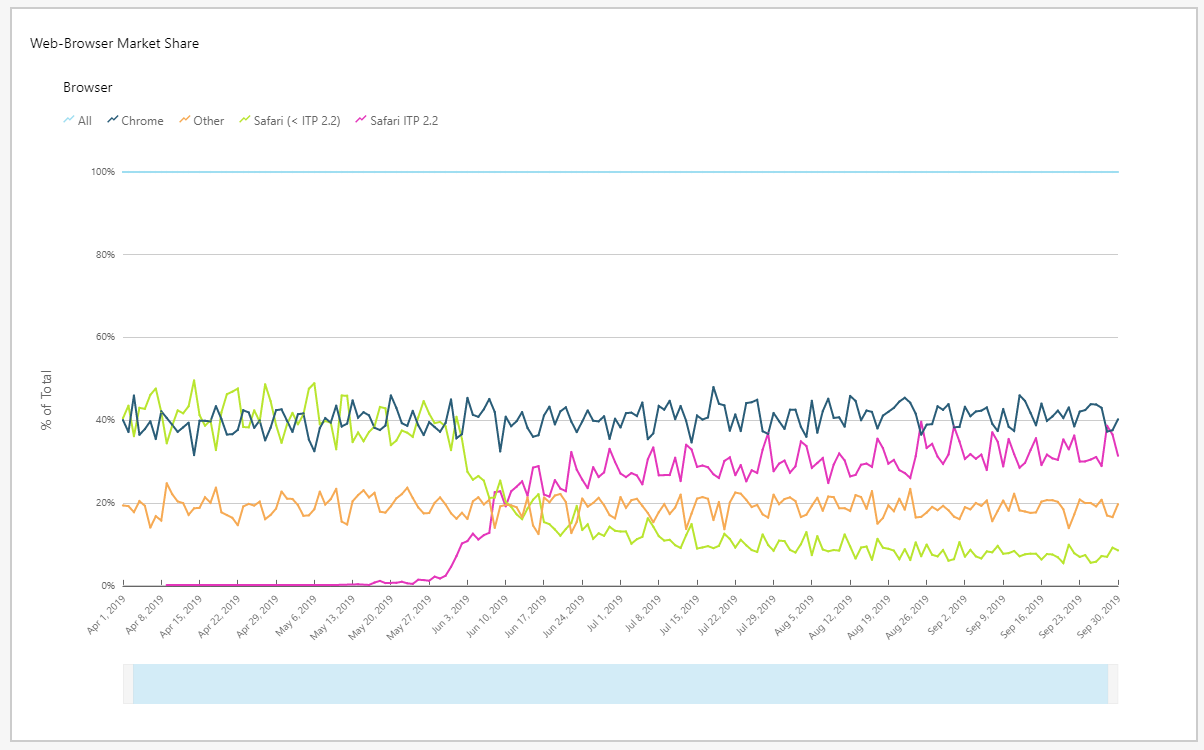
The next chart you'll see is the Web Browser Market Share chart. This gives you an at-a-glance view of exactly which browsers have been driving your conversions since ITP first started interrupting first-party cookies. Most importantly, this chart lets you know the percentage of your conversions (attributed or unattributed) which were delivered via the the latest version of Safari ITP.
"Conversion Time Lag" Charts (Multiple Views)
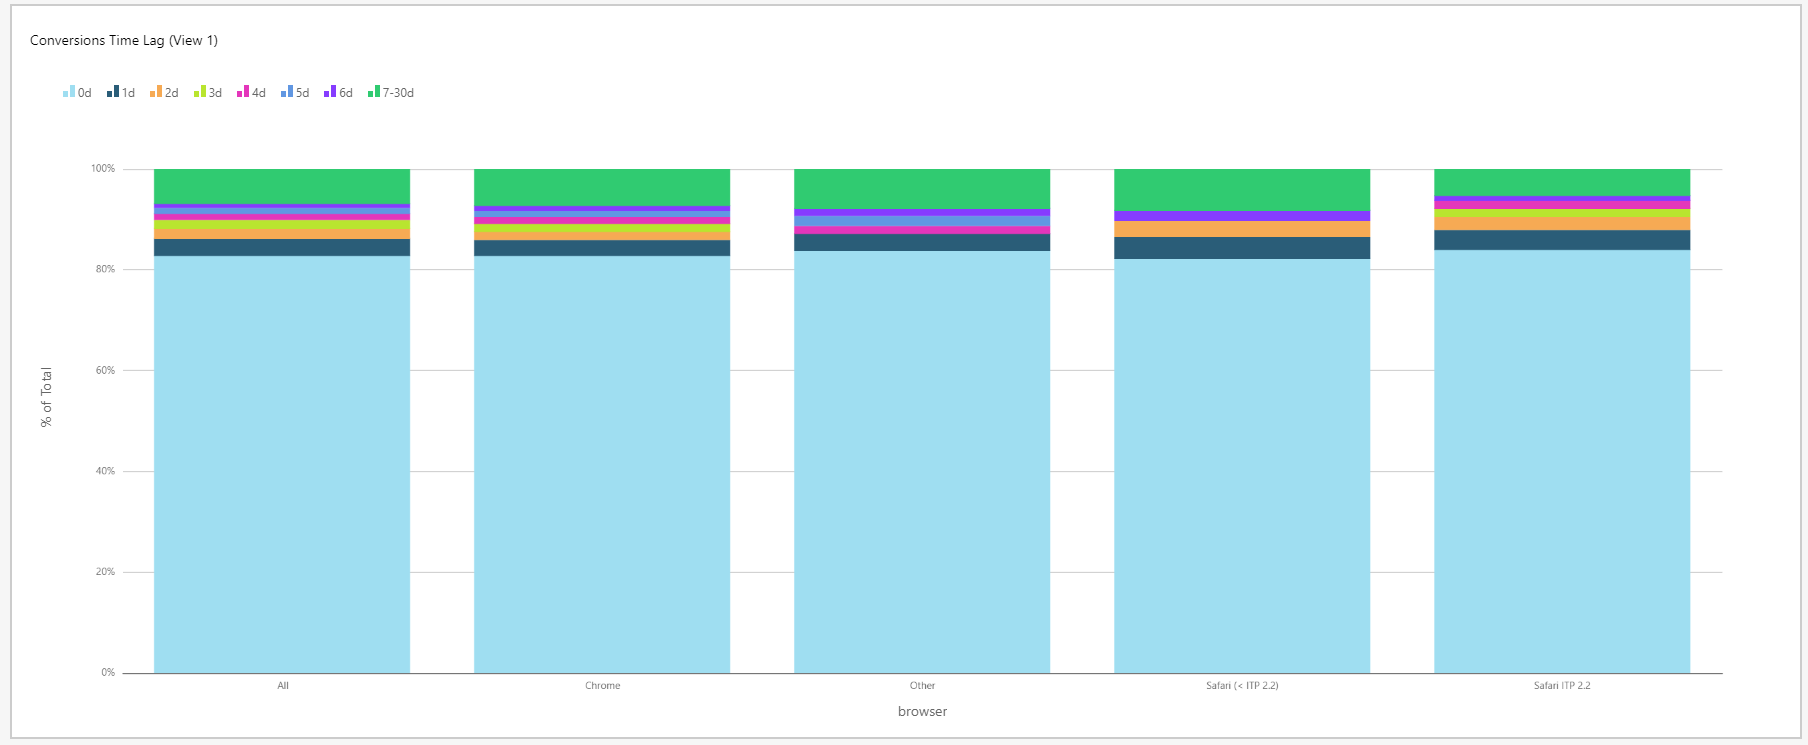
The final two charts on the ITP Dashboard are technically showing you the same data, but in slightly different ways for variable analysis.
The aim of the the Conversion Time Lag charts is to show you how ITP is actually impacting your recent conversions – as opposed to the above Conversions At Risk chart, which tracks the worst-case scenario. We are currently finding that Safari is not consistently applying the strongest ITP versions, even on the latest Apple software. These charts work by allowing you to compare your attributed conversions, broken down by latency groups, on the latest version of Apple ITP vs. Chrome (which is unaffected by ITP). Are you seeing a drop-off?
If you choose to implement a solution for ITP impact (see the next section for more details on that), you can also use these Conversion Time Lag charts to track performance of the fix. Left alone without a fix applied, any conversions via Safari ITP 2.2 beyond the 24-hour expiry duration would be lost, so continuing to see these conversions beyond this timeframe would be a good sign.
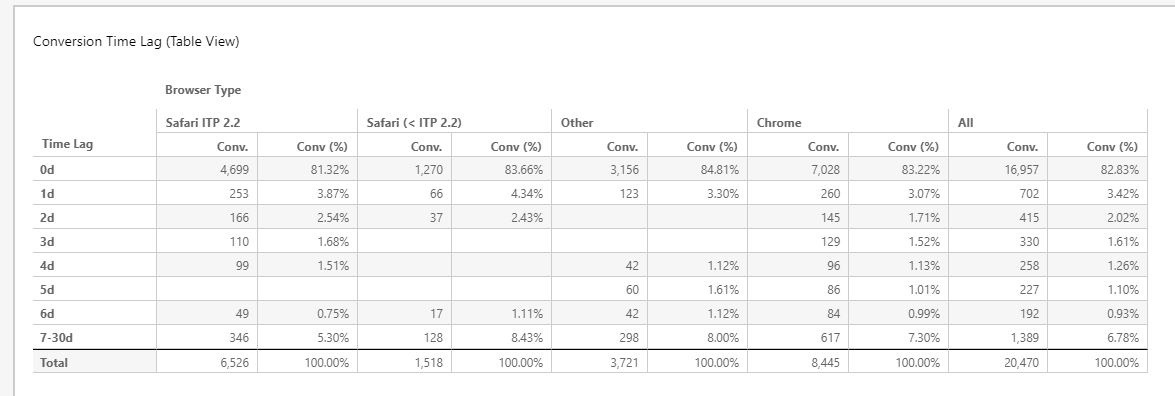
The Conversion Time Lag charts include two types of bar chart which you can mouse-over for more details, as well as a table view for those who like to see the hard numbers.
Solutions For ITP Impact
Our ITP Dashboard offers you a quick and easy way to monitor the impact of ITP on your campaigns. Over time, as impact grows, we understand you may want to work around this -- especially if it's negatively affecting your performance.
With this in mind, our team has been working hard to offer solutions which enable tracking even with ITP in place via Marin Tracker. Below are the three available solutions:
- Use HTTP cookies. This option works by having you as the advertiser set the Marin cookie via HTTP response (server-side). This works because ITP only affects cookies set via JavaScript -- not those set via HTTP requests from the domain a user is visiting.
- Advertiser-Marin Tracker CNAME. With this option, you'll implement a new first-party SSL certificate for first-party cookies. This would involve updating a CNAME record for your domain. We would update the Marin Tags to use this new host, which will allow the Marin Tracker Server to set and receive cookies via HTTP(S) response.
- Server-2-Server. With this more advanced and involved solution, we would move the data flow to your server-side and away from client-side completely. This involves adding logic on your server to configure it to send your web analytics data to Marin.
If you'd like to learn more about tracking solutions for ITP, please contact your platform representative.
